
How to Create Seating Charts in Canvas
How to Create Seating Charts in Canvas
Video Walkthrough
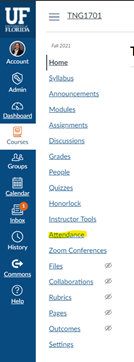
You can find seating charts in Canvas by selecting Attendance in the Course Navigation. Attendance is enabled in your course navigation by default, but if you can’t find it, go to Settings and find the Navigation tab to add it. Make sure you save!
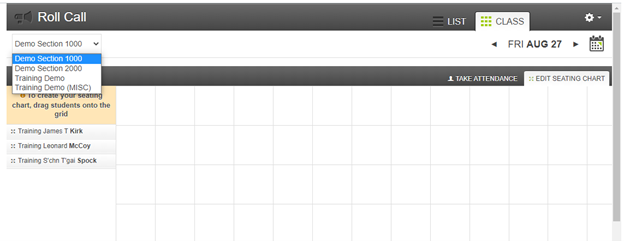
The Attendance page has a drop-down menu at the top where you can select a section. Choose the “Seating Chart” section and then drag and drop the students from the list on the left to the appropriate box in the chart. Each box represents a seat, but you cannot change how many rows and columns are visible, so only use the ones you need.
Finally, this feature is intended to help instructors take attendance, so if you do not grade attendance in your class, you should go to the Roll Call Attendance assignment settings and check the "Do not count this assignment toward the final grade" box.
